Kanban Business Intelligence: clear data, more control
The benefits of the new KanbanBOX feature for collecting and organizing your data in thematic dashboards
What is Kanban Business Intelligence (Kanban BI)
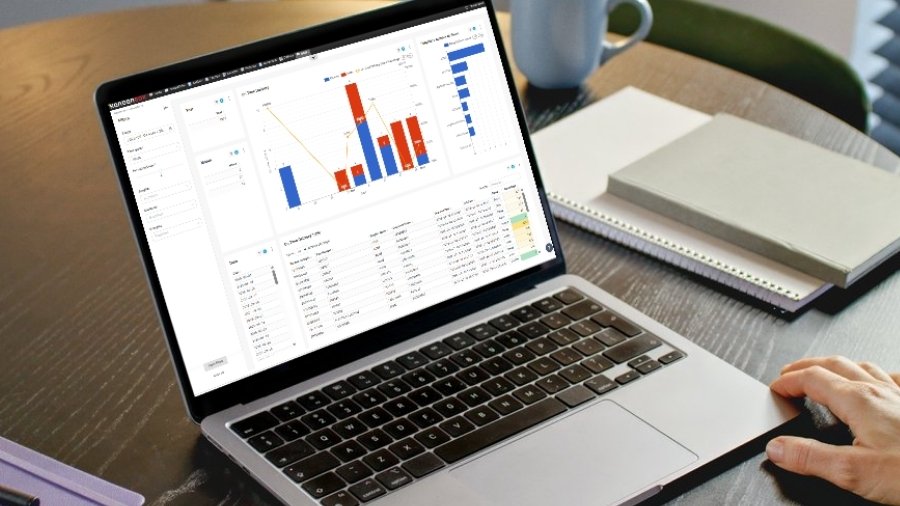
Kanban Business Intelligence (or Kanban BI) is the new KanbanBOX feature that allows you to analyze your kanban system data. Directly from the platform, you can access dashboards specifically designed to monitor stock levels, supplier punctuality, stockouts, and other key supply chain KPIs.
Let’s look at the concrete benefits of this feature for daily operations.
One single tool to truly understand what’s happening on the shop floor
With Kanban BI, you can identify where flows are blocked, check supplier reliability, analyze consumption trends, and support your decisions with real data.
All within one environment, with the same visual and intuitive logic of KanbanBOX.
This awareness is useful not only for identifying and resolving issues faster, but also for tracking results over time. For example, in the case of a company pursuing continuous improvement, Kanban BI is a key tool because it allows you to:
- Measure the real results of kanban resizing, such as the real-time value of your inventory
- Monitor process KPIs without complex configurations
- Link every action to a measurable effect, day by day.
For instance, the “On Time Delivery” report provides the Purchasing Manager with objective data to support negotiations with each supplier.
At the same time, the Production Manager can use the same data to analyze shortages, identify the root causes of line stoppages, and define targeted corrective actions.
More broadly, this is how the Lean Manager can shift from “it seems to be working” to “we can prove it works.”
Faster decisions with clear and immediate information
Every day, those managing production need to answer specific questions:
- Why are we stockpiling so much of that component?
- Why do we keep having stockouts on the same item?
- What is the real punctuality level of our suppliers?
- How many purchase orders are we issuing each month, and with what financial impact?
You can now find the answers in Kanban BI, with ready-to-use and intuitive dashboards, designed for those who work daily with materials, suppliers, and production.
No advanced analytics skills or complex data interpretation are needed: the data is aggregated and transformed into intuitive charts that make information immediately clear and accessible. This allows you to quickly spot unusual stock increases, recurring stockouts, or late deliveries.
In seconds, you know where to act, no more guesswork.
For instance, the “On Time Delivery” report provides the Purchasing Manager with objective data to support negotiations with each supplier.
At the same time, the Production Manager can use the same data to analyze shortages, identify the root causes of line stoppages, and define targeted corrective actions.
More broadly, this is how the Lean Manager can shift from “it seems to be working” to “we can prove it works.”
Ready-to-use analysis without effort, wasted time, or extraction errors
KanbanBOX users know the software tracks all kanban cards and their information, useful for tracing any anomalies.
Kanban BI completely eliminates manual data handling.
Dashboards are already set up, update automatically in real time, and pull directly from KanbanBOX, no need to export files or manually refresh data, as required by other business intelligence tools.
This allows you to always work with updated and reliable data, avoiding copy-paste errors or outdated information. All while saving time and mental energy that can now be spent not on building reports, but on improving processes.
A single data source, always updated and aligned
How often do different departments work on different data, pulled from various and/or partial sources, or with missing information due to lack of synchronization?
With Kanban BI, this risk disappears: all data comes from a single source (KanbanBOX) updated in real time, always consistent and accessible to those who need it.
For example, both the Production Manager and the Lean Manager can access the platform and consult the same reliable, synchronized information, without wasting time comparing different versions or subjective interpretations.
This way, meetings become shorter and more focused, because everyone starts from the same information base.
Instant adoption and zero learning curve
Kanban BI is an advanced module of KanbanBOX. This means there’s no need for any integration or complex configuration of external BI systems or new software.
Anyone with a KanbanBOX license can immediately start using the “KanbanBOX Performance” dashboard, which displays key data and indicators such as the number of active loops, the types of loops, the number of connected external suppliers, and more.
In addition to this dashboard, free for all users and designed to give a useful KPI overview for any company, you can unlock additional premium dashboards simply by going to the “Reports” section and activating the feature from the platform.
In just a few minutes, the dashboards will be unlocked, and the user can start navigating and reading data independently, with no need for technical skills or additional training.
A constantly evolving module with customization options
Kanban BI is a module designed to grow over time, along with the needs of the companies that use it.
In addition to the dashboards already available, you can request the development of custom dashboards, designed to best represent your processes and the specific KPIs of your production environment.
Our team is available to analyze your needs and develop tailored solutions, ensuring maximum consistency with your data and the KanbanBOX structure.
Moreover, the module is constantly being updated: new dashboards will be released progressively and automatically made available to all users who have activated Kanban BI.
A concrete way to provide you with increasingly complete, effective, and aligned analysis tools to support your continuous improvement journey.