Business Intelligence with Microsoft Power BI
Turn data into decisions, starting from the right information
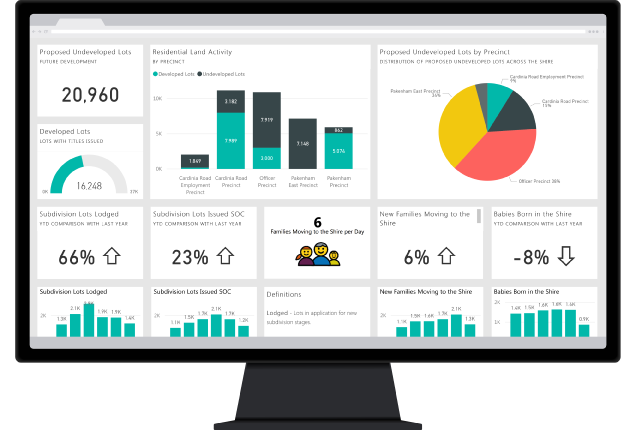
Power BI is Microsoft’s Business Intelligence software designed to analyze, visualize, and share data in a simple and effective way.
Thanks to interactive dashboards and dynamic reports, it allows you to monitor business performance and make decisions based on up-to-date data.
More and more companies use it to gain clear visibility into what is happening in production, purchasing, and sales, improving control and decision-making capabilities.
The Benefits of Power BI
Intuitive data visualization
Turn complex data into clear, easy-to-read dashboards accessible at every level of the organization
Customizable dashboards and reports
Build tailored analyses by choosing KPIs, layouts, and levels of detail based on your specific needs and goals
Integration with other systems
Connect multiple data sources (ERP, Excel, or other software) to gain full visibility into your business
To analyze data, you first need to collect it (properly)
Power BI is an extremely powerful data analysis tool.
But there is one key point: the quality of your analysis depends on the quality of your data.
If data is entered manually, collected incompletely, or not updated in real time, even the best Business Intelligence tool loses its effectiveness.
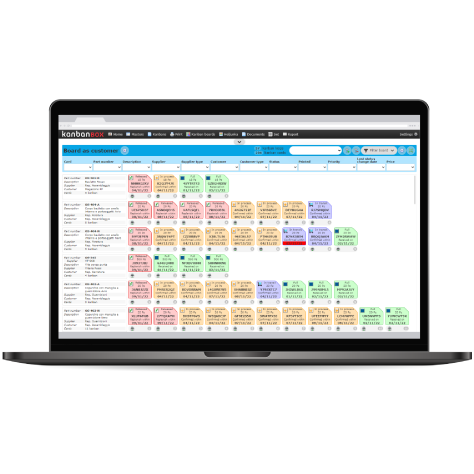
This is where KanbanBOX comes in: the electronic kanban software that allows you to automatically collect operational data directly from the real material flow, while also optimizing its management.
Reliable data, automatically collected from the real flow
KanbanBOX enables you to automatically track reliable, always up-to-date data, because it is generated directly from the actual consumption and movement of materials throughout the entire process.
This means your data does not rely on manual input or estimates, but reflects what is really happening in production, making it more accurate, timely, and useful for both operational and strategic decisions.
What you can track with KanbanBOX
- Purchase orders, generated based on actual consumption
- Inventory stock levels, always up to date
- Production orders, aligned with demand
- Movement of raw materials, semi-finished, and finished goods
- Order status, even in multi-stage environments
- Sales orders, connected to the operational flow
This allows Power BI to work with reliable, consistent, and real-time data.
Power BI and KanbanBOX: not just tracking, but optimizing
KanbanBOX is not just a tool for collecting data for Power BI: it is a system that helps you optimize purchasing, production, material handling, and sales flows.
In particular, it enables you to achieve:
- Real-time visibility on orders and materials, including suppliers and subcontractors
- Average inventory reduction of up to 51%
- Average lead time reduction of up to 71%
- Easier management and planning of multi-stage and/or multi-plant flows
- Flexible production sequencing
- Demand leveling
Full supply chain visibility
With KanbanBOX, you can monitor in real time the progress of orders and processes, both internally and across suppliers, customers, and subcontractors.
See howReduce inventory without stockouts
Optimize stock levels while maintaining operational continuity. With KanbanBOX, this is possible
Learn moreShorten lead time and higher responsiveness
KanbanBOX allows you to optimize stock and production management, while increasing production flexibility
See how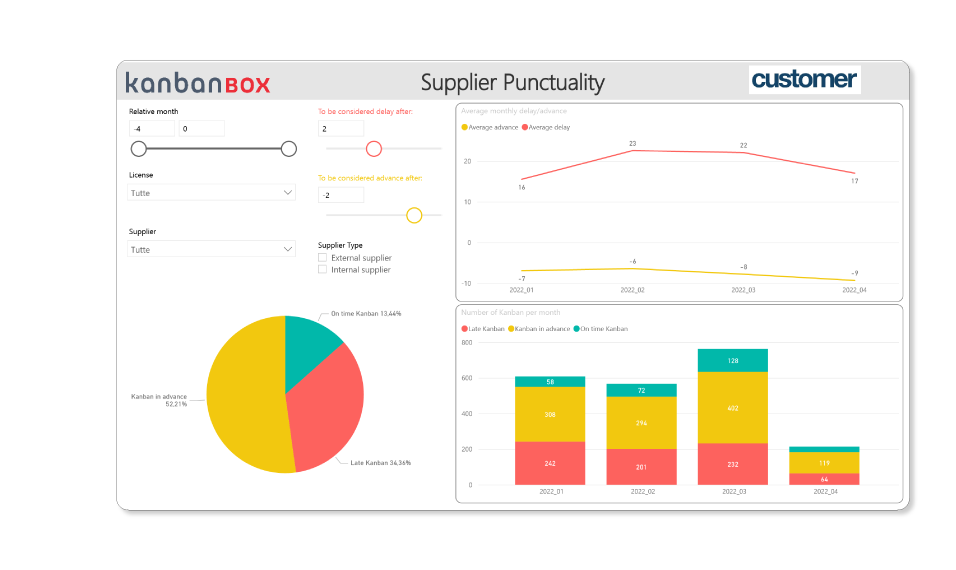
Power BI is an extremely powerful tool, but without a system that allows you to collect reliable data and take action on identified issues, its value remains limited.
That’s why KanbanBOX exists.
Do you have any questions?
Case studies
Sacchi | Electrical Supply Distribution
Sacchi uses KanbanBOX to offer its customers a kanban-based sales service, ideal for recurring supplies and supports long-term customer loyalty
Oleodinamica Marchesini | Hydraulic valves
Oleodinamica Marchesini has optimized its production flow management by implementing multi-process kanban and pull production
Robopac | Packaging machines
With KanbanBOX, Robopac achieved a more integrated, responsive, and digitalized supply chain thanks to the integration with both external suppliers and SAP
BCS | Agricultural Mechanization
BCS moved from push to pull through E-kanban for suppliers, production, and internal flows. They now manage 6000 kanban loops across 3 plants
El.Co. | Industrial Electrical Automation
El.Co. has simplified the maintenance of kanbans with e-kanban, which was previously so onerous that the number of parts managed by kanban had to be limited
Orotig | Welding Industry
Orotig has implemented sequential pull in the company, optimizing multi-process production scheduling and supplier integration with KanbanBOX
Rossi SpA | Gearmotors and Electric Motors
Rossi Spa has digitalized the existing production and move kanban, then integrated it with its own ERP, with Oracle Sequencer and with suppliers
Aptiv | High-tech automotive systems
From the introduction of kanban to the transition to e-kanban. The Lean Improvement journey of the largest manufacturer of electronic interconnection systems for the automotive sector
References